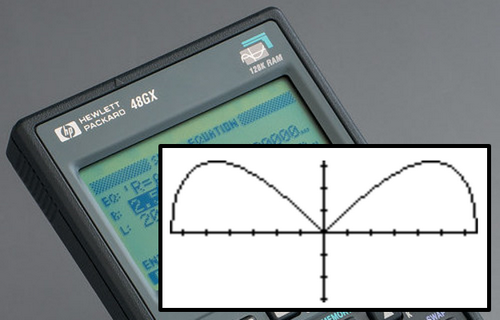
Plotting an implicit function FXY(X,Y)

Calculator: HP48GX
Author: Philipps Roussel
Language: English
Reference(s):
A question raised by an HP48GX user during a support call (through Email) was whether it is possible to plot an implicit function f(X,Y) with X as the independent variable and Y as the dependent variable, while still using the PLOT INFORM menu to specify the viewing and plotting (calculation) ranges. Of course, the answer is yes. It even doesn’t require much programming, although a few minor pitfalls are lurking…(I fell in one of them during my first attempt).